A Look to the Week Ahead: Hanging Man
Will there ever be a reversal...

6/6
10/12
18/22
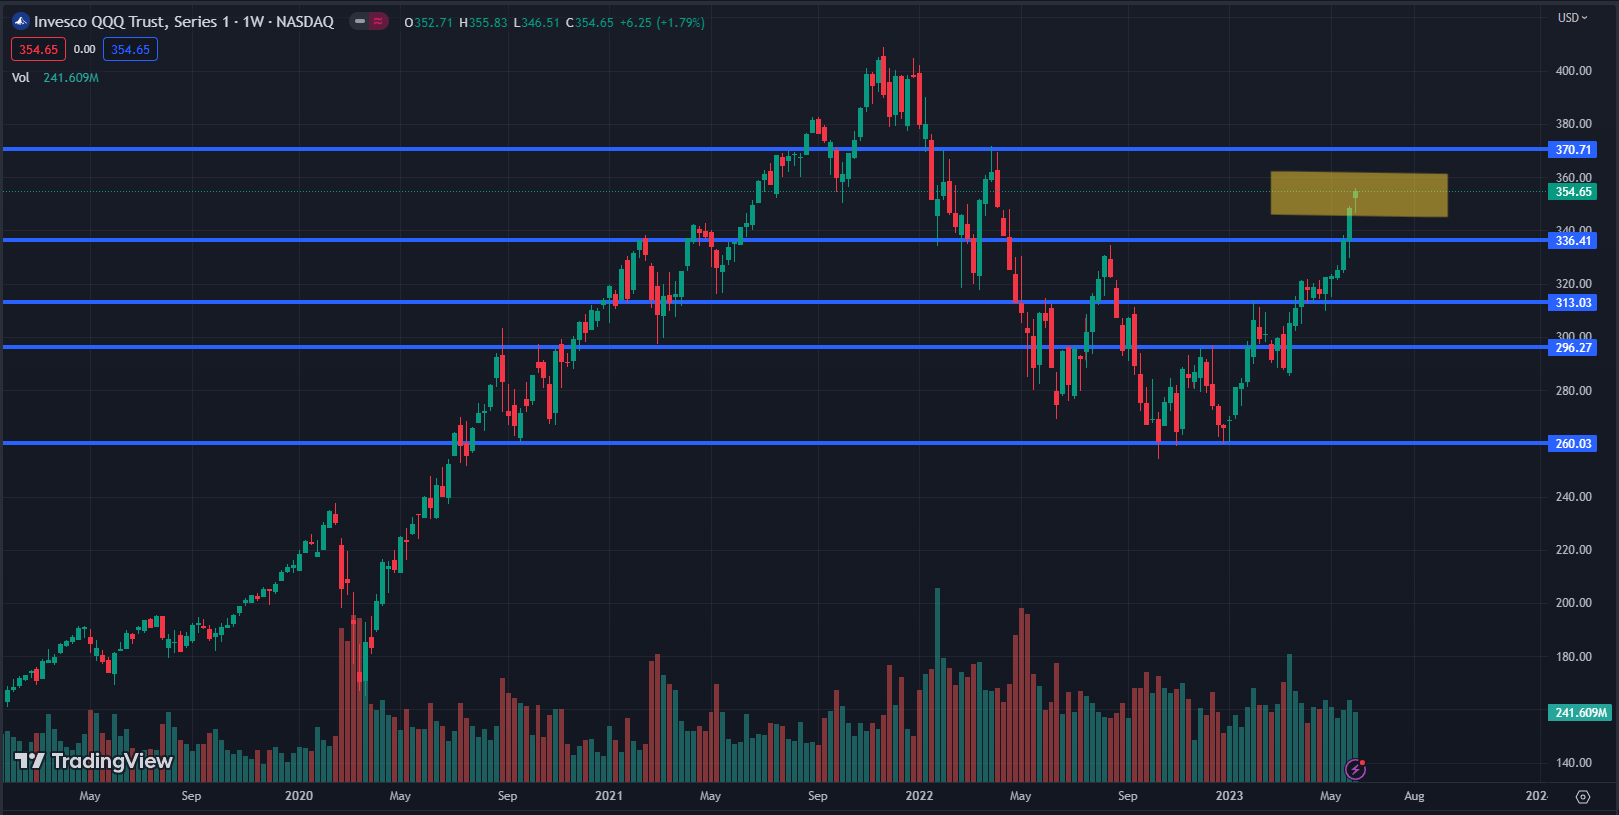
Those are the staggering number of green weeks on the Nasdaq over the last twenty two weeks across different timeframes.
The Nasdaq has dropped only four of the last twenty-two weeks, with the current rally now extending to six straight, jumping 14.5% in that timeframe alone.
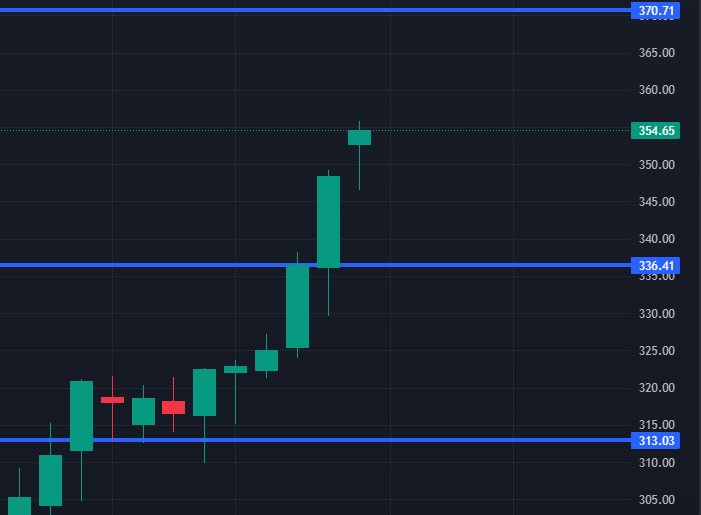
However, this latest weekly candle has caught our attention:


Zooming in we can see, amongst the forest of green candles, a distinct "hanging man" candlestick.
Hanging man formations are characterized by their long lower wicks, narrow bodies and most importantly, appear with a gap up, which is why the candlestick representing the week-ended May 5th, is invalid, as no gap-up is present there.
However, in last weeks candlestick, we see all the signs, leaving intrigue in whether or not the pattern will follow through:


